Exploring your personal Netflix viewing history…
TLDR
If you’d like to generate your own Netflix data visualisation, feel free to make use of this Jupyter notebook:
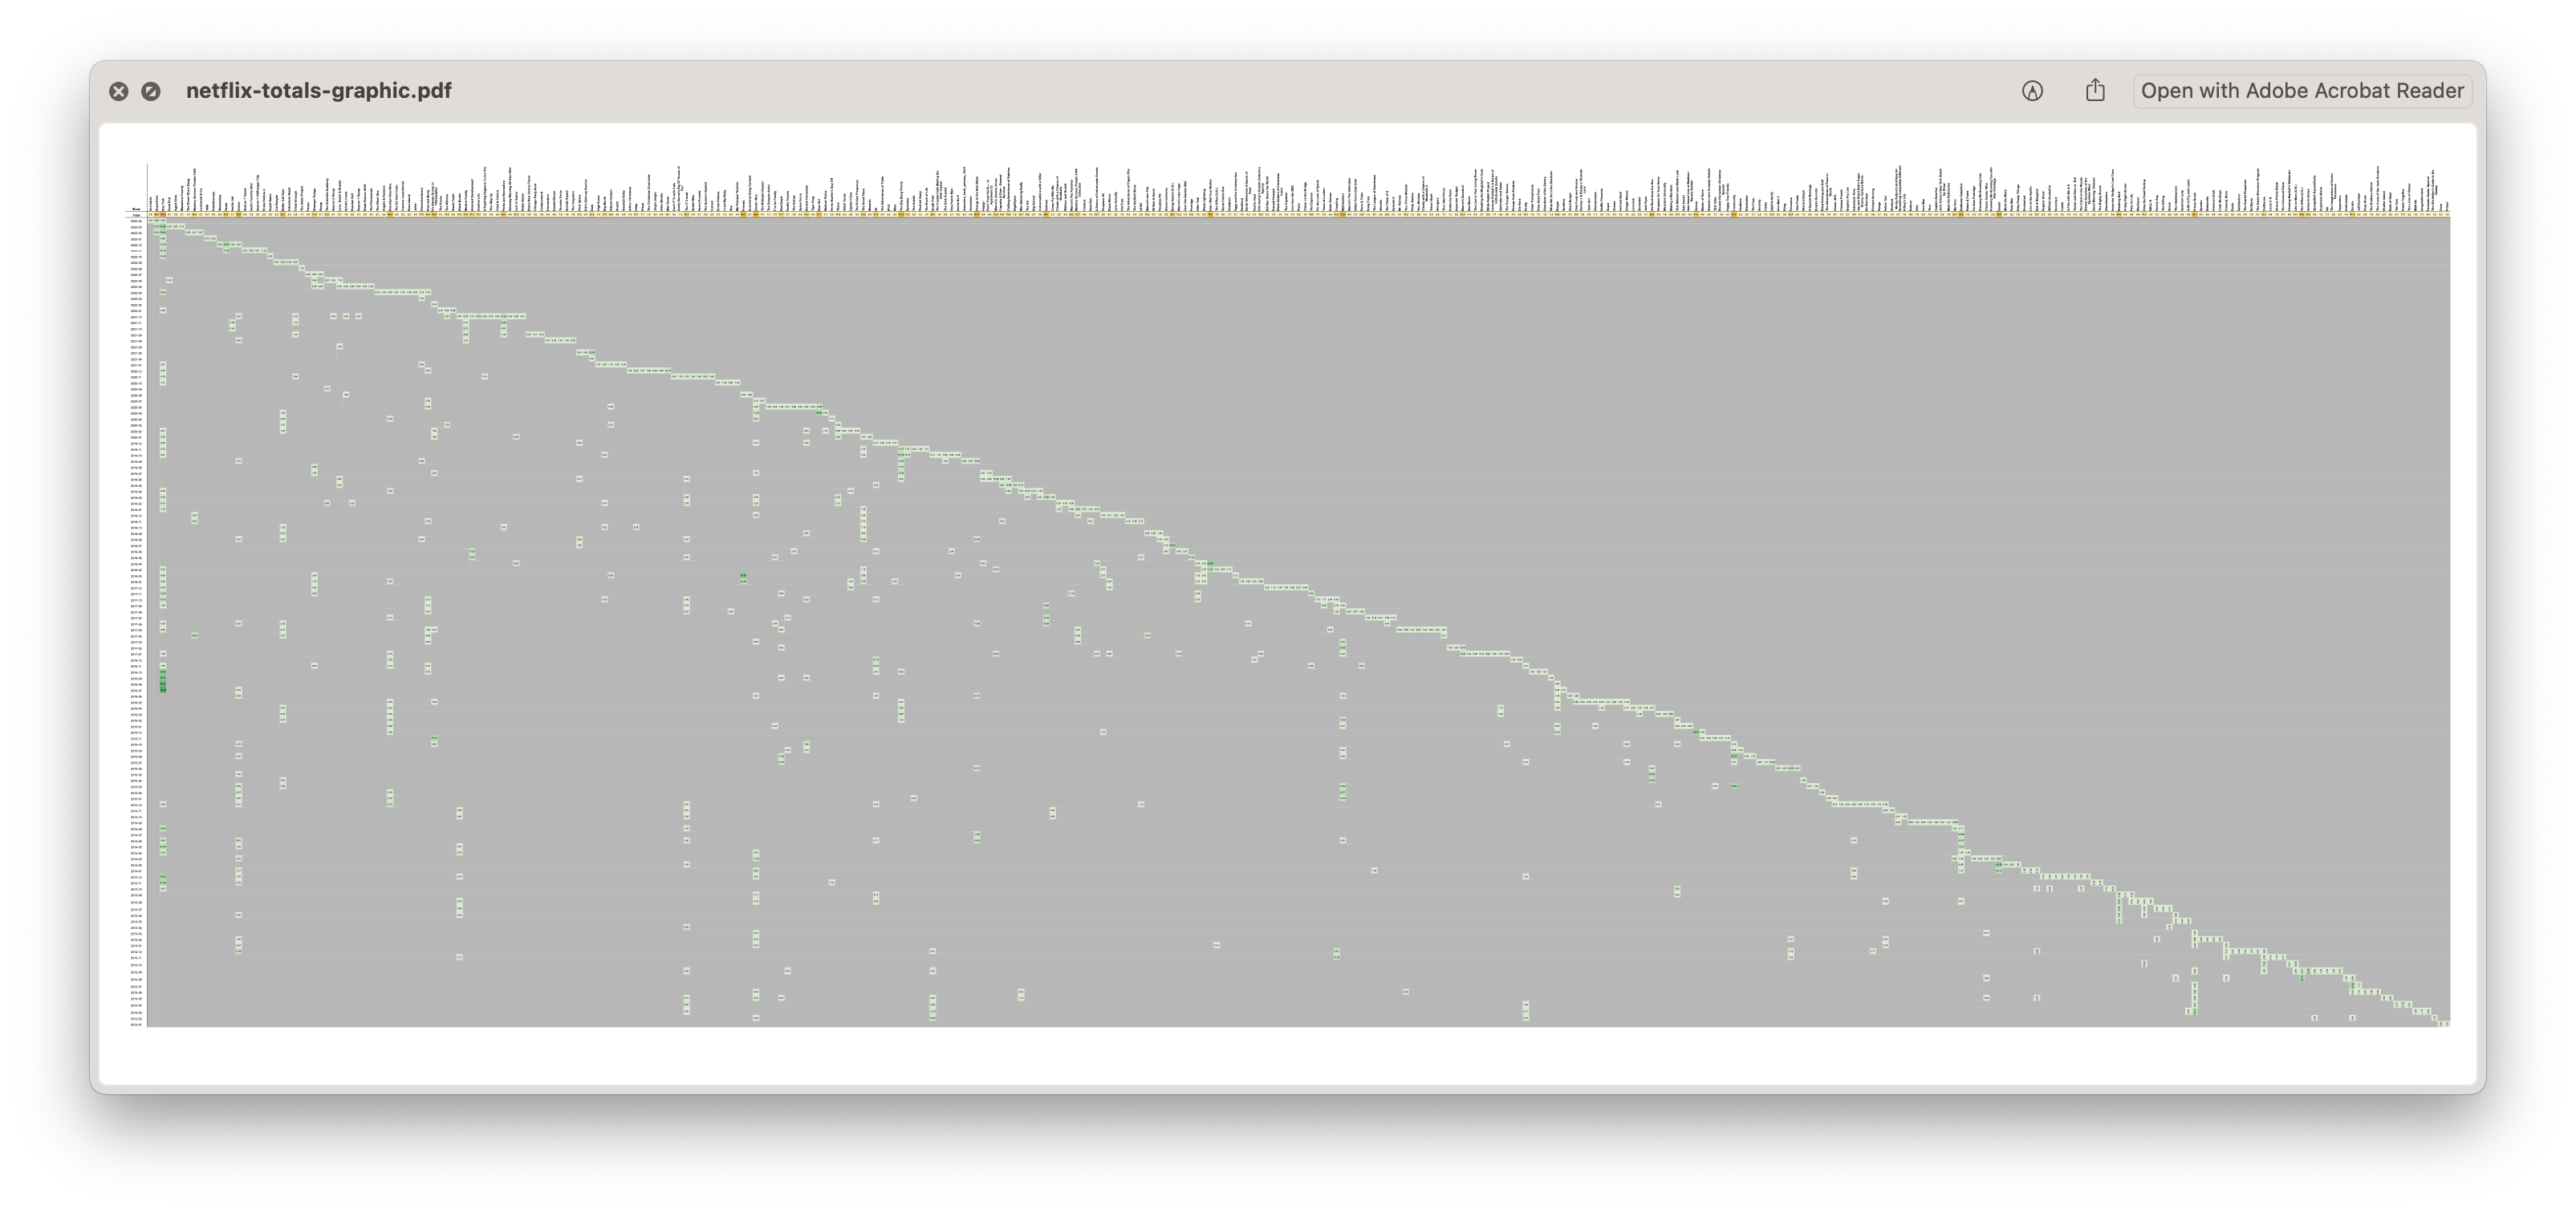
What does it look like?
What you see is a visualisation of everything I’ved watched since 2012. If you’d like to explore my data, I’ve embedded a copy of my processed monthly viewing at the bottom. If you want to find out how to generate this for yourself, read on!
Let’s get into it…
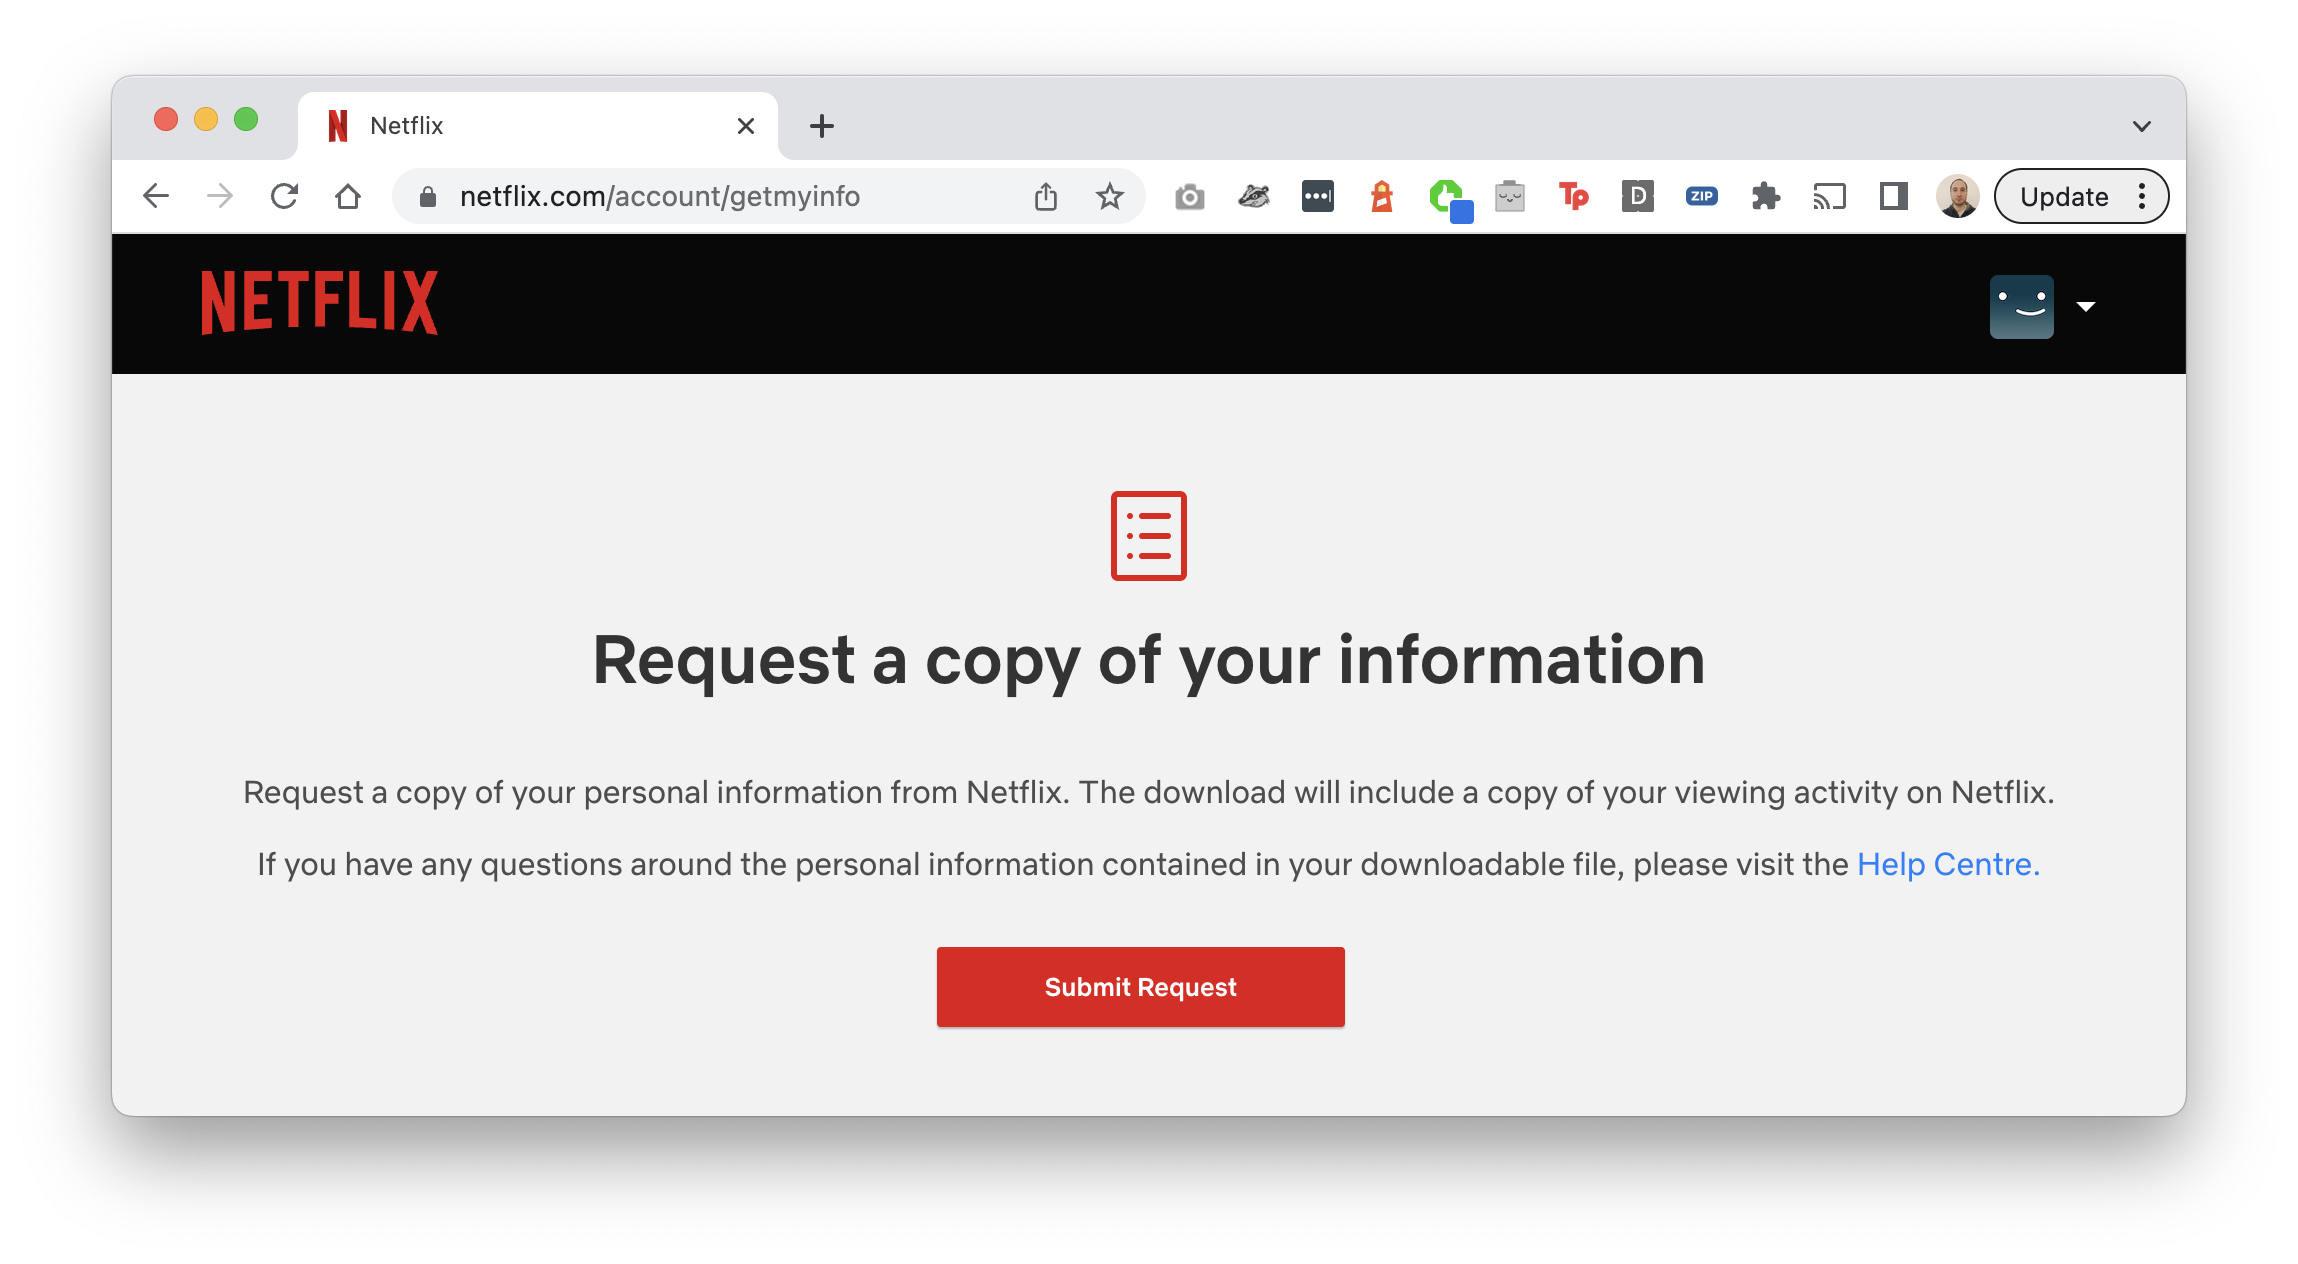
Curious to see what data they hold, I recently requested all my Netflix data. You can make this sort of request through your account settings.
Requesting your data
You can find this option in your settings, under SECURITY & PRIVACY, choose: Download your personal information (or just use this link)
It takes a few days to process, and then you’ll receive an email notification letting you know that your data is ready. Follow the link, and you’ll be able to download a zip file with all your data.
What’s inside?
There’s rather a lot of data - as Netflix are giving you just about everything they know about you.
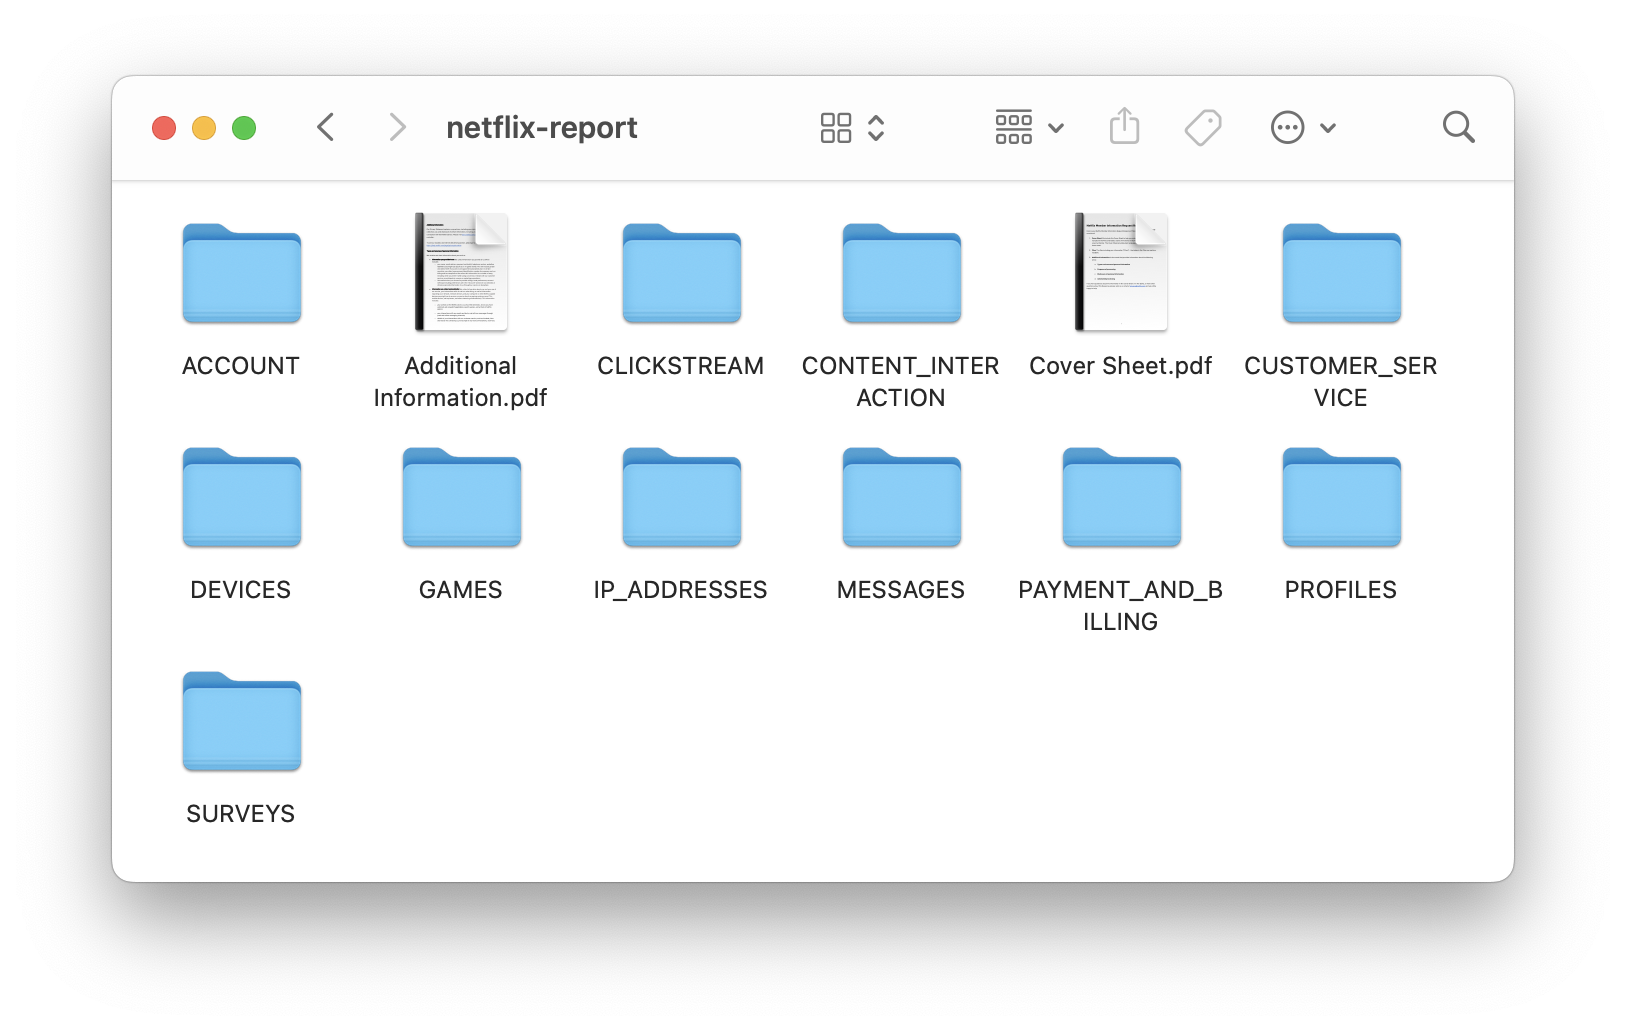
Your watching history is available inside the CONTENT_INTERACTION folder. The raw data is in a file called: ViewingActivity.csv
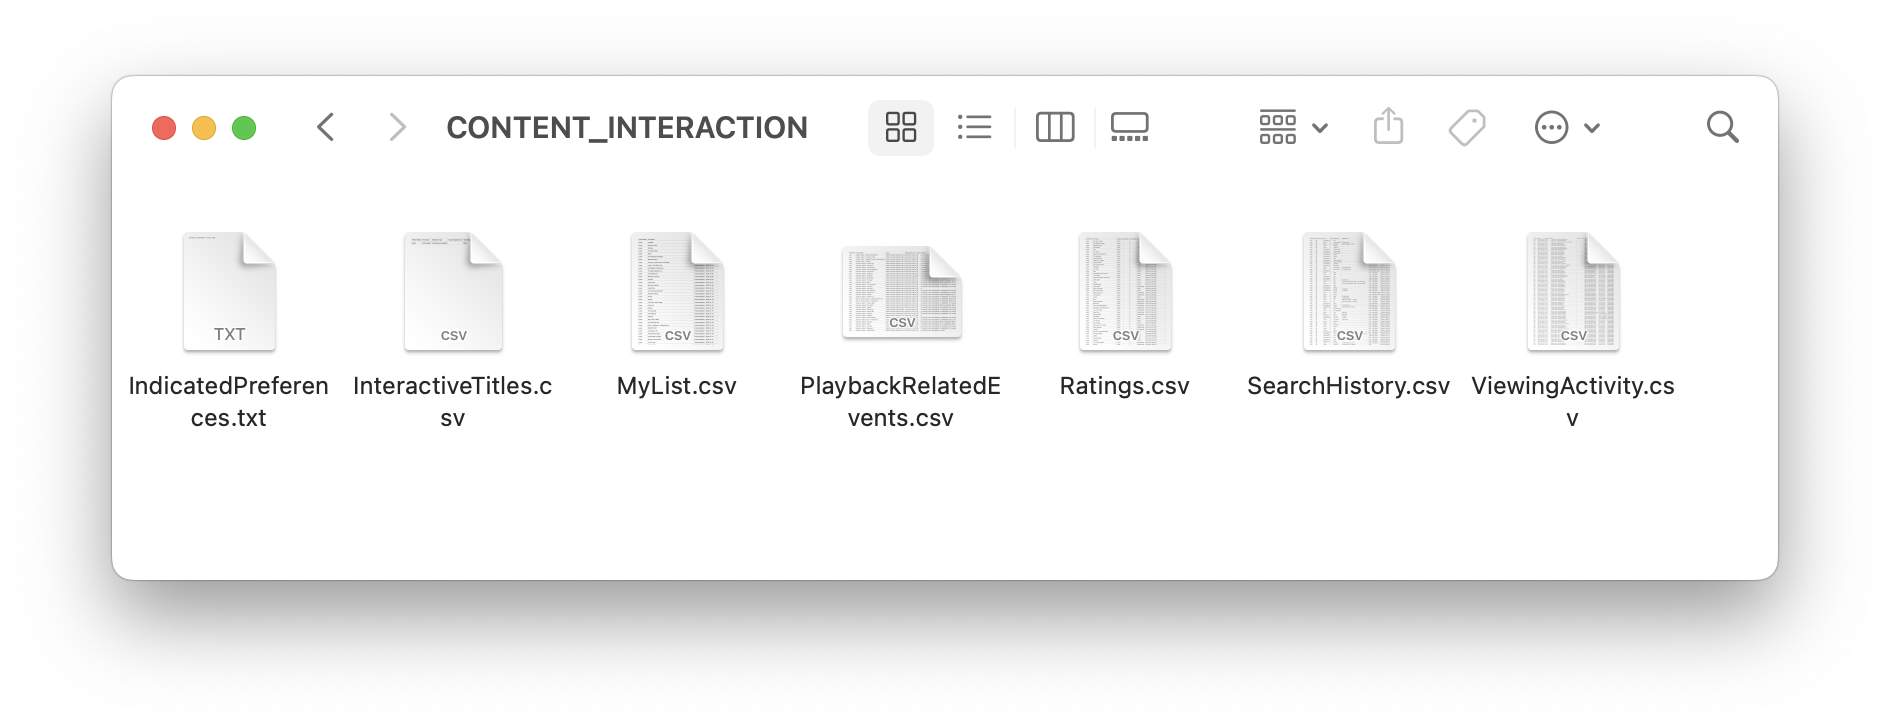
ViewingActivity.csv has several columns that we’ll be using as a starting point for collating your viewing data:
Profile Name - which profile was watchingStart Time - time that each watch session beganDuration - duration of each watching sessionTitle - the title that was watched
Titles can, by and large, be split by colon, eg. Parks and Recreation: Season 1: Canvassing (Episode 2) This means that in most cases you can extract the name of the show or film title as the first part - before the first colon.
Processing the data
Everything’s split across viewing sessions at the moment - so if you watched a show over the course of a month, that’s represented by a record for every time you sat down to watch. To make some sense of it, we’ll aggregate the data to be able to see durations for each show by month. Here’s a handy Jupyter notebook you can use for this:
It’ll aggregate the data across months, and provide you with a few different outputs - including a grid of months and shows - where each cell value is the number of hours of that show you watched that month.
Nice clean data
Of course, all data has a few issues and I ended up massaging mine a little further in Google Sheets to improve the visualisation.
- Ordering shows by the last time they were watched gives a nice watch line making it easier to see what you watched and when.
- Some episodes from older shows didn’t contain the show’s name in the title. (A notable example is a lot of the Mythbusters show data. They had long titles, but didn’t have a
Mythbusters: prefix at all.) This means they won’t be counted as the same show until you fix the data. I did mine manually - it wasn’t too much effort.
Once I had the data in Google Sheets, I also added totals for each show as an additional top row, and some conditional formatting to make the patterns of watching clearer. It came out rather nicely, I thought: